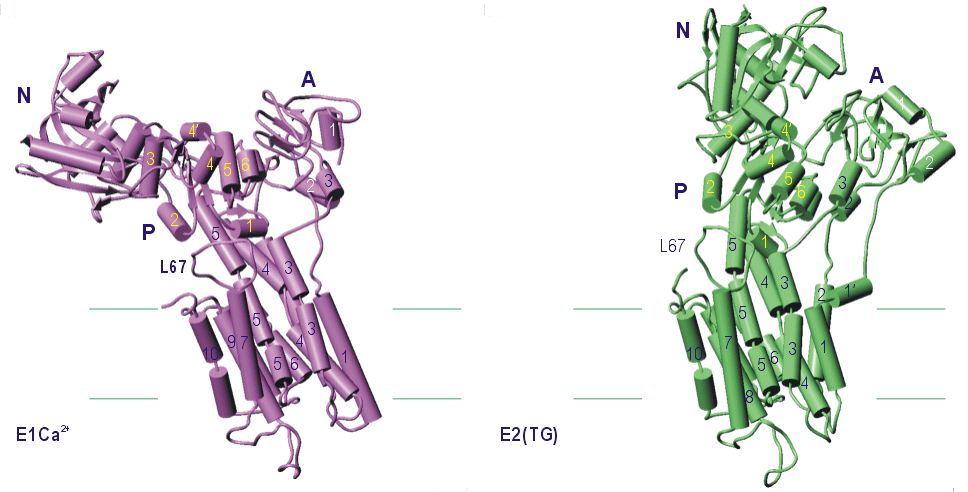
Animation 1. SR Ca2+-ATPase in E1Ca2+ and E2(TG) states, viewed along the a-axis. Corresponding to Fig. 2a.

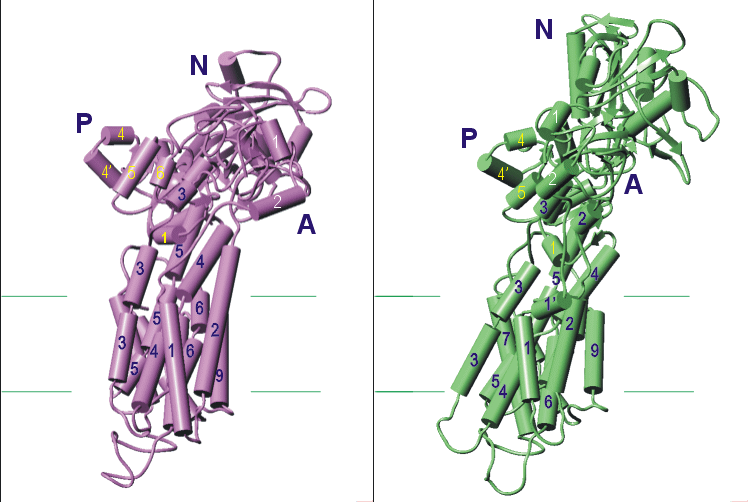
Animation 2. SR Ca2+-ATPase in E1Ca2+ and E2(TG) states, viewed along the b-axis. Corresponding to Fig. 2b.

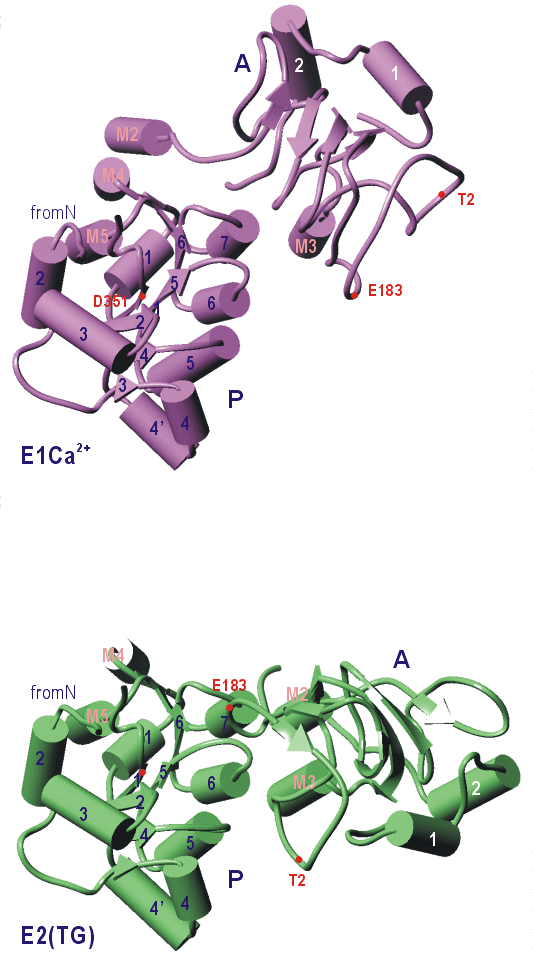
Animation 3. A- and P- domains of SR Ca2+-ATPase in E1Ca2+ and E2(TG) states, viewed from the top. N-domain is removed for clarity.

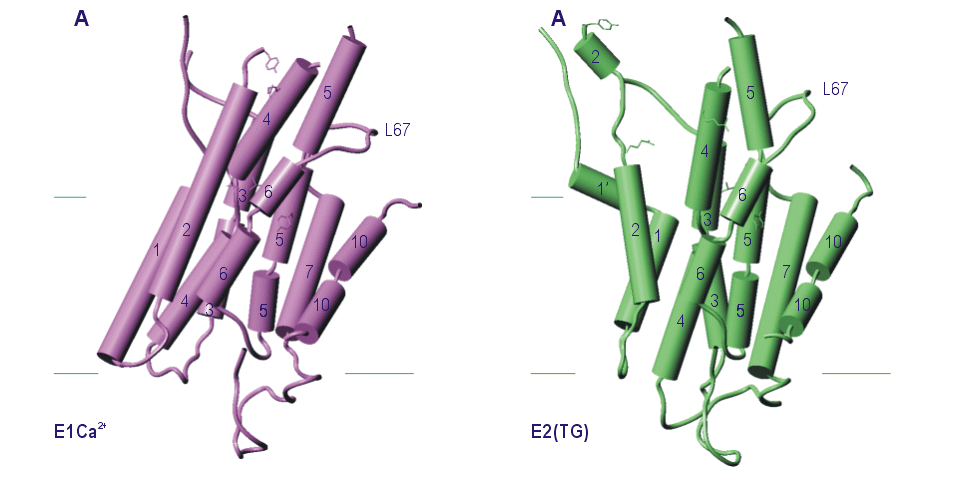
Animation 4. Transmembrane domain of SR Ca2+-ATPase in E1Ca2+ and E2(TG) states. Corresponding to Fig. 4a.